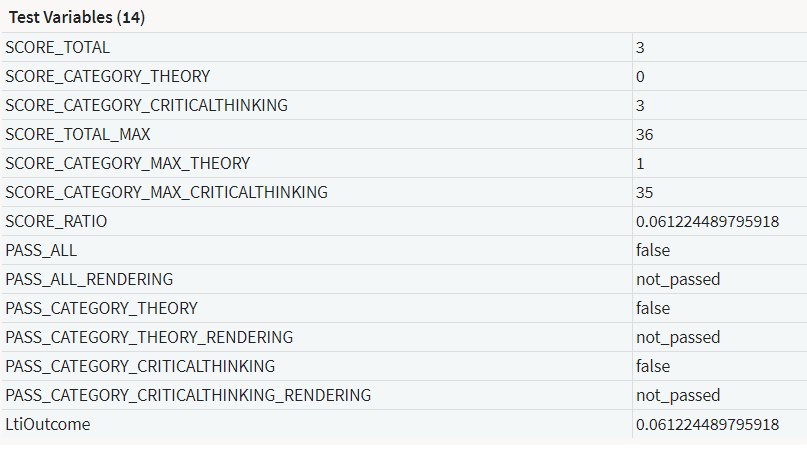
The groups of values in the Test Variables table are:
- the scores the test-taker got
- the scores the test-taker could have got
- the ratio between correctly answered and incorrectly answered test items
- whether the test-taker passed or failed
So that you don't have to keep jumping back to the last section to look at the table again, the relevant part is reproduced here:
Test-taker Scores
The first group contains the scores which were awarded to our test-taker, Abigail. In the example these are:
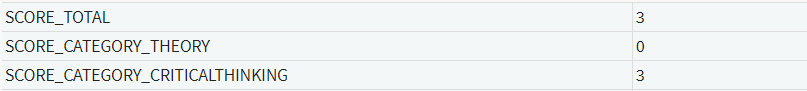
SCORE_TOTAL denotes the score a test-taker has received over the whole test. If your test was divided into categories (i.e. domains defined externally), there will also be separate scores for each category. In other words, alongside the overall score for the whole test there will also be a list of partial scores. These come next, and are prefaced by SCORE_CATEGORY, followed by the name of the category in question.
In our example there were two categories in the test: Theory and Critical Thinking.
In the first column, we can see that Abigail had an overall score of 3. She scored 0 points in the Theory section, and 3 points in the Critical Thinking section.
Possible Scores
The second group contains the possible scores which Abigail could have got. These are:
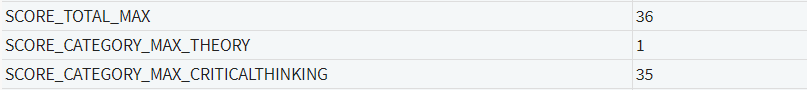
SCORE_TOTAL_MAX is the maximum possible score over the whole test. After that come the maximum scores possible for any existing categories – here, for the two categories in the test Abigail took.
The overall number of points Abigail could have been awarded was 36: 1 point in the Theory section, and 35 points in the Critical Thinking section. In other words, she got 0/1 in Theory, and 3/35 in Critical Thinking.
Score Ratio

The third group contains just one value: the SCORE_RATIO. This is the ratio of correct to incorrect answers which the test-taker gave, so if all answers were correct, the SCORE_RATIO is 1. If some of the answers were incorrect, the value would be below 1. Abigail has a score ratio of about 0.06. This value is then reproduced in LTIOutcome (at the bottom of the table).
Whether the test-taker has passed or failed
The fourth group contains the pass values. These tell you if the test-taker has passed or failed, both the test overall as well as each category in it.
Note: A pass or fail can only be awarded if the test has been configured with a score at which a pass is awarded. The User Guide can tell you about this scoring method.
If the test-taker has passed the whole test (PASS_ALL), or the category in question (PASS_CATEGORY), you will see the value true in the column next to it. If they have failed, you will see the value false. Each true/false value is then rendered as passed or not_passed in the values of the same names which end in _RENDERING.
In the example these are:
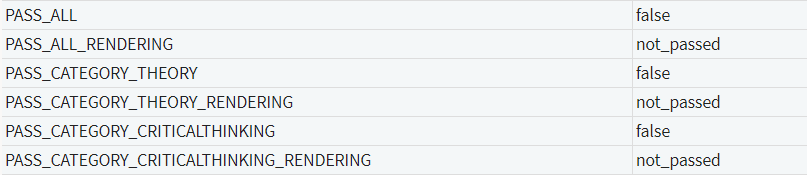
Unfortunately, Abigail failed the test overall and did not pass either of the two categories Theory or Critical Thinking.
Below the Test Variables Table come the Item Statistics. We'll look at these in the next section.